
If you have Google Analytics installed on your website but rarely log in, you are not alone. Many business owners set it up, receive occasional reports, and assume everything is working as it should.
The issue is not access to data. It is knowing what to look at and what it means for your business.
If you are not reviewing the right metrics regularly, small issues can go unnoticed. Over time, those issues can affect lead quality, conversion rates, and overall performance.
This guide focuses on the key metrics that actually matter, and how to monitor them in a way that helps you make better decisions.
What should you be looking for in Google Analytics?
Google Analytics can show you hundreds of different data points. Most of them are not necessary for day-to-day decision making.
For most B2B websites, three areas give you a clear picture of performance:
- Traffic
- Engagement
- Conversion rate
Together, these tell a simple story:
- Are people finding your website?
- Are they staying and exploring?
- Are they taking action?
When reviewed consistently, these metrics help you spot problems early and understand what is working.
Are you getting the right level of traffic?
Traffic is often the first metric people check, and for good reason. If nobody is visiting your website, nothing else can happen.
In Google Analytics, you will typically look at:
- Users (how many people visit your site)
- Sessions (how often they visit)
- Traffic sources (where they came from)
This gives you a baseline. Are your numbers growing, steady, or declining?
However, traffic on its own can be misleading. An increase in visitors does not always mean an improvement in performance. It depends on who those visitors are and what they do next.
Are visitors actually engaging with your website?
Once people arrive on your site, the next question is whether they stay and explore.
Engagement metrics help you understand this. Key indicators include:
- Engagement rate
- Average engagement time
- Pages per session
These metrics show whether your content is holding attention. If users leave quickly or only view one page, something is not connecting.
This could be down to messaging, page structure, or how clearly you guide visitors to the next step.
Are visitors turning into enquiries?
Traffic and engagement are important, but they only matter if they lead to action.
Conversion rate measures how many visitors complete a desired action, such as:
- Submitting a contact form
- Calling your business
- Downloading a resource
If your conversion rate is low, it often points to issues with:
- Clarity of your offer
- Strength of your calls to action
- Relevance of your traffic
This is where many websites fall short. They attract visitors but do not convert them into leads.
Why looking at site-wide data can hide problems
A common mistake is reviewing these metrics at a global level only.
At first glance, everything might look positive. Traffic is increasing, engagement is improving, and conversions appear steady.
However, this can hide what is really happening underneath.
For example:
- Blog content may be driving most of your traffic
- Visitors may spend time reading articles
- Service pages may receive very little attention
- Conversion-focused pages may be underperforming
In this situation, overall metrics look healthy, but your most important pages are not doing their job.
This is why breaking your data down by page type is essential.
How does analysing page types improve insight?
Instead of looking at your website as a whole, it helps to group pages into categories, such as:
- Service pages
- Product pages
- Blog articles
- Homepage
- Contact page
By analysing these separately, you can see how each part of your website contributes to performance.
For example:
- Are your service pages attracting traffic?
- Do visitors engage with your product pages?
- Which blog posts bring in the most relevant users?
- Does your contact page convert effectively?
This level of insight makes it much easier to identify where improvements are needed.
Great direction, this is exactly the right section to strengthen. I’ll refine just that part with more practical, step-by-step guidance while keeping the tone aligned.
Here’s an improved version you can drop into your article:
How to set up custom reports in Google Analytics (GA4)
To properly understand how different parts of your website are performing, you can use Explorations in GA4 to create custom reports.
This allows you to group and filter your data so you can analyse specific page types, rather than relying on site-wide averages.
Here is a practical way to set this up.
Step one: Open Explorations
In Google Analytics:
- Go to ‘Explore’ in the left-hand menu
- Click ‘Blank’ to create a new exploration
You will now see a workspace where you can build your report.
Step two: Add your dimensions and metrics
On the left-hand side, click the ‘+’ icon next to Dimensions and import:
- Page path and screen class
- Page title
Then click the ‘+’ next to Metrics and import:
- Users
- Sessions
- Engagement rate
- Conversions
Once added, drag these into your report:
- Add ‘Page path’ or ‘Page title’ into Rows
- Add your metrics into Values
This gives you a basic view of how individual pages are performing.
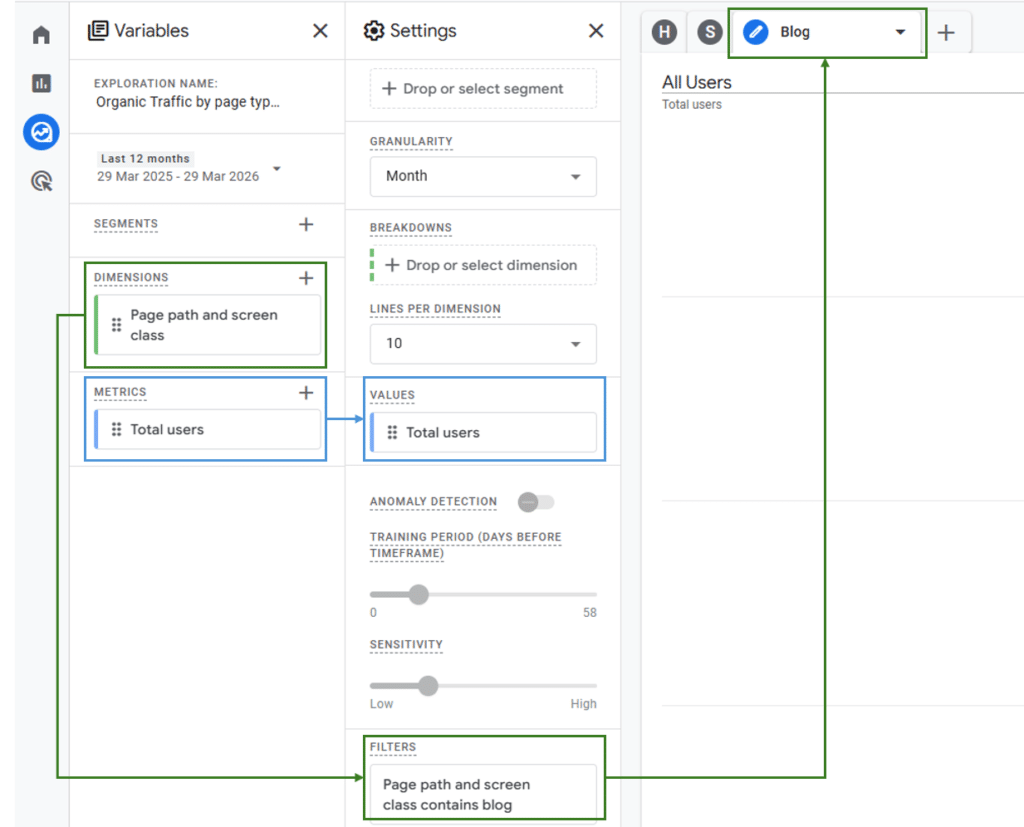
Step three: Create your first filtered view (e.g. blog pages)
To focus on a specific page type, you now need to apply a filter.
In the Tab Settings panel (on the right):
- Scroll down to ‘Filters’
- Click ‘Add filter’
Set up your filter like this:
- Dimension: Page path and screen class
- Match type: contains
- Value: /blog/
This tells Google Analytics to only show data for URLs that include ‘/blog/’, which typically represents your blog content.
Once applied, your report will update to show only blog page performance.
Step four: Duplicate tabs to compare page types
Rather than building multiple reports, you can duplicate tabs within the same exploration.
This makes it easy to switch between views.
To do this:
- Right-click on your current tab (e.g. “Blog Pages”)
- Click ‘Duplicate’
Rename the new tab to match the page type you want to analyse, such as:
- Service Pages
- Homepage
- Contact Page
Step five: Update filters for each page type
In each duplicated tab, update the filter to match the relevant page group.
For example:
Service pages:
- Filter: Page path contains /services/
Homepage:
- Filter: Page path exactly matches /
Contact page:
- Filter: Page path contains /contact
Each tab now shows a different slice of your website, while using the same core metrics.
Step six: Compare performance across tabs
You can now move between tabs to compare:
- Which page types attract the most traffic
- Where users spend the most time
- Which sections of your site generate enquiries
This is where the real insight comes from.
For example, you may see strong engagement on blog content but low conversions on service pages. That highlights a clear opportunity to improve internal linking or strengthen calls to action.
Step seven: Save and reuse your report
Once set up:
- Click ‘Save’ on your exploration
- Return to it weekly or monthly to review performance
Over time, this gives you a consistent way to monitor your website and spot changes early.
What should you do with this data?
The goal is not to collect data for the sake of it. It is to make informed decisions.
Once you can see how different parts of your website perform, you can take practical steps, such as:
- Improving internal links from blog posts to service pages
- Updating service page messaging to better match user intent
- Strengthening calls to action on key landing pages
- Identifying content gaps based on what users are searching for
Small, consistent improvements based on real data tend to outperform large, one-off changes.
A simple way to stay on top of your website performance
You do not need to check Google Analytics every day.
A simple approach is:
- Review key metrics once per month
- Focus on traffic, engagement, and conversions
- Compare performance by page type
- Look for trends rather than isolated spikes
This gives you enough visibility to act early without getting lost in the detail.
Final thoughts
Google Analytics is only valuable if you use it.
Most businesses already have the data they need. The difference comes from understanding which metrics matter and reviewing them consistently.
If your website is meant to generate leads, your reporting should reflect that. Traffic, engagement, and conversion rate provide a clear and practical way to measure performance.
When you break this down by page type, you move from general observations to specific actions.
If you are not sure what your data is telling you, or you want help turning insight into improvements, it may be time to take a closer look at how your website is performing.
Schedule a discovery call and we can walk through your data together.